
I have been playing with a few image projects using
PIL, and decided that I wanted to create some RGB histograms of my images that I could use on my website. I am a keen photographer and I will we uploading my images to my blog soon, but I wanted to have something a little different.
It is quite normal for people to post up EXIF data from their images but not many people post up histograms. There is a reason for this, and thats after the image has been through post processing there is not really alot of point of the histogram, but what the hell I will post it anyway.
So I took a look at PIL to see how it could help me out, and I have put together a small script that reads the image data and produces a nice histogram of it. The example histogram shown above has been created from the following image. You can click though to view the full size image on Flickr.

So here is the script that makes the histogram, feel free to copy and adapt it to do whatever else you want it to do. I have created a few variables at the top of the script that should allow people to quickly modify the code to fit in with their own styling.
# RGB Hitogram
# This script will create a histogram image based on the RGB content of
# an image. It uses PIL to do most of the donkey work but then we just
# draw a pretty graph out of it.
#
# May 2009,  Scott McDonough, www.scottmcdonough.co.uk
#

import Image, ImageDraw

imagepath = "mZXN_1979"  # The image to build the histogram of


histHeight = 120            # Height of the histogram
histWidth = 256             # Width of the histogram
multiplerValue = 1.5        # The multiplier value basically increases
                            # the histogram height so that love values
                            # are easier to see, this in effect chops off
                            # the top of the histogram.
showFstopLines = True       # True/False to hide outline
fStopLines = 5


# Colours to be used
backgroundColor = (51,51,51)    # Background color
lineColor = (102,102,102)       # Line color of fStop Markers
red = (255,60,60)               # Color for the red lines
green = (51,204,51)             # Color for the green lines
blue = (0,102,255)              # Color for the blue lines

##################################################################################


img = Image.open(imagepath)
hist = img.histogram()
histMax = max(hist)                                     comon color
xScale = float(histWidth)/len(hist)                     # xScaling
yScale = float((histHeight)*multiplerValue)/histMax     # yScaling


im = Image.new("RGBA", (histWidth, histHeight), backgroundColor)
draw = ImageDraw.Draw(im)


# Draw Outline is required
if showFstopLines:
    xmarker = histWidth/fStopLines
    x =0
    for i in range(1,fStopLines+1):
        draw.line((x, 0, x, histHeight), fill=lineColor)
        x+=xmarker
    draw.line((histWidth-1, 0, histWidth-1, 200), fill=lineColor)
    draw.line((0, 0, 0, histHeight), fill=lineColor)


# Draw the RGB histogram lines
x=0; c=0;
for i in hist:
    if int(i)==0: pass
    else:
        color = red
        if c>255: color = green
        if c>511: color = blue
        draw.line((x, histHeight, x, histHeight-(i*yScale)), fill=color)
    if x>255: x=0
    else: x+=1
    c+=1

# Now save and show the histogram
im.save('histogram.png', 'PNG')
im.show()
I am planning on adding more to this script and will probably and the CMY colors to it in the near future so that it is more similar to the Adobe Lightroom Histogram.
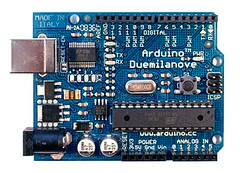 I received my Arduino Duemilanove yesterday so last night I rushed off to Maplin's to buy myself a handfully of goodies to start playing around. I bought myself a bunch of LEDs a bag of resistors and a couple of tactile switches.